Netigate and Lumoa join forces to become the leading European experience management solution 🎉 Read more here.
Quick Analysis
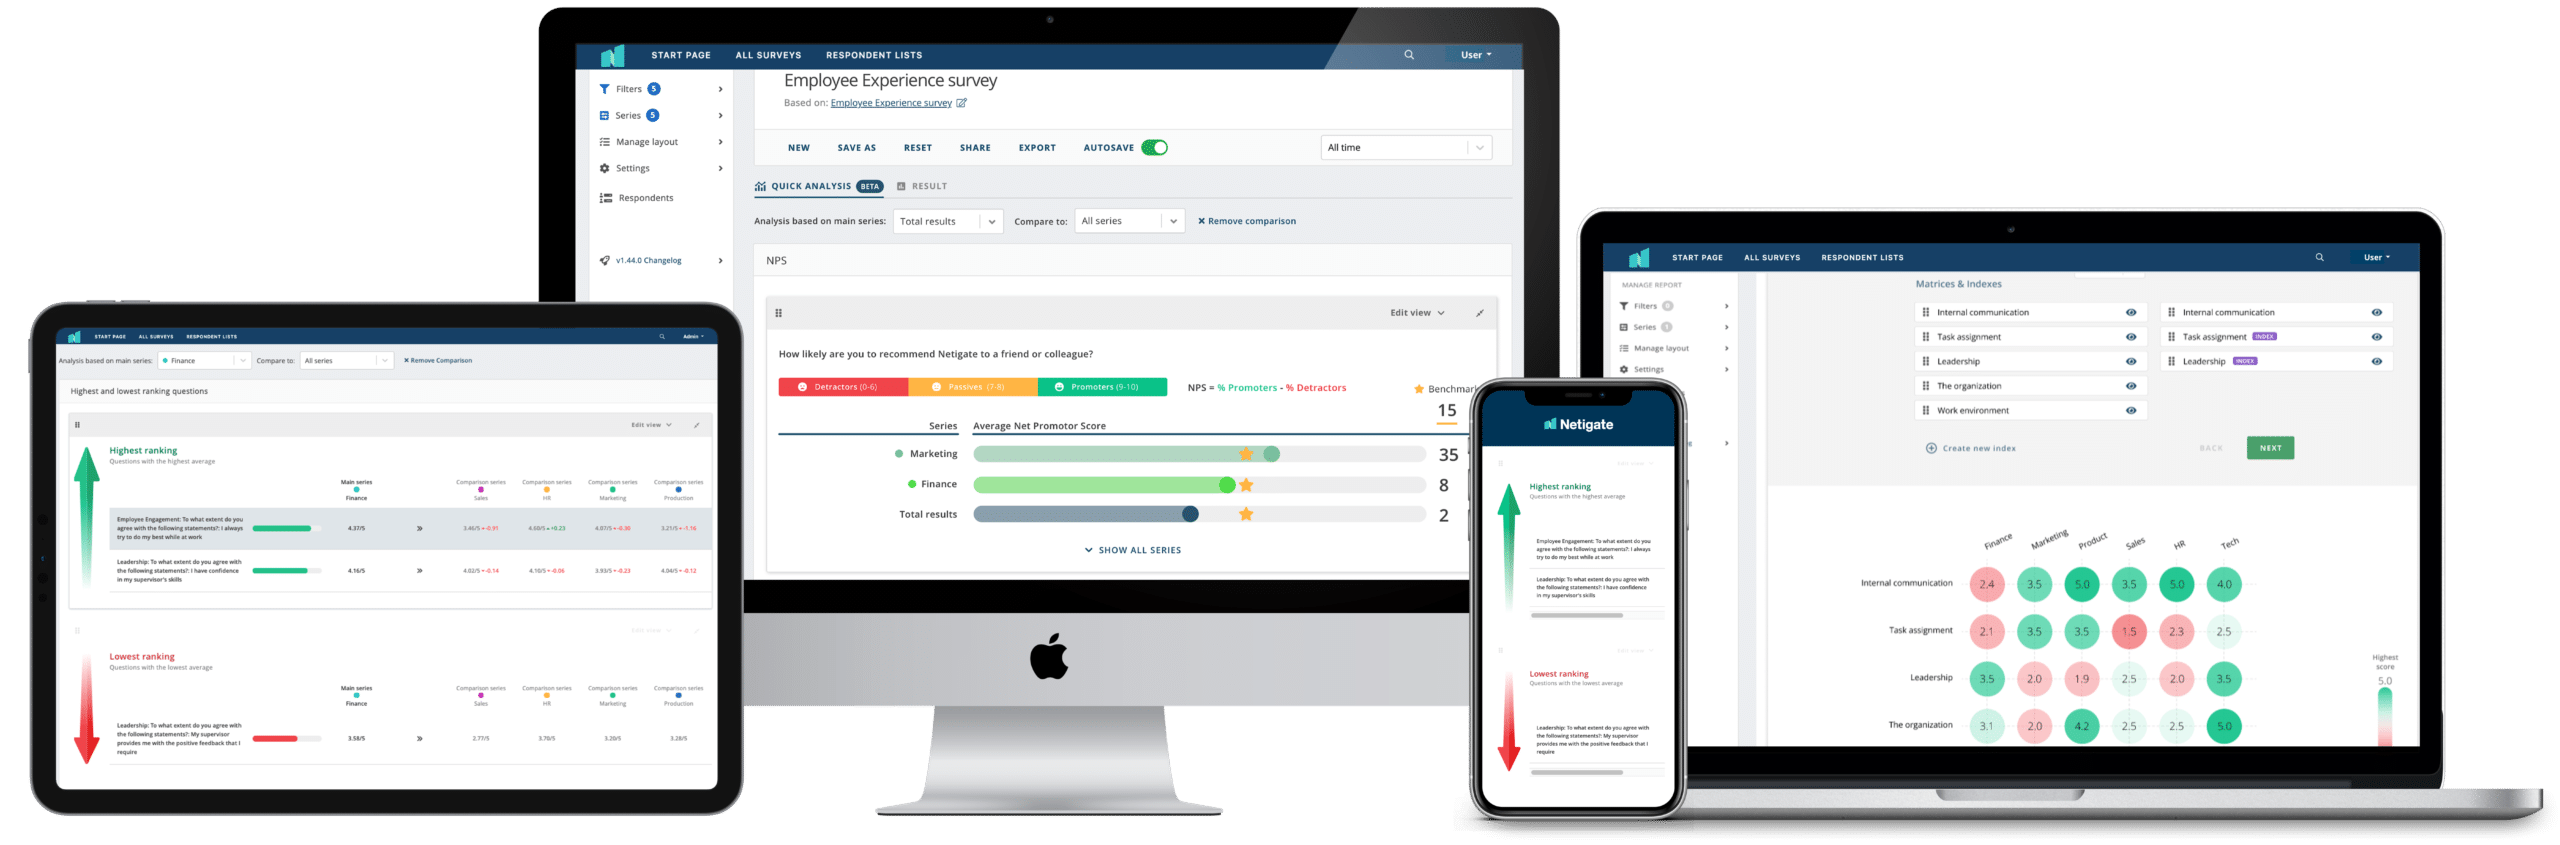
Insights in an instant
It's now easier than ever before to start taking action and driving positive change.
Quick Analysis is your partner in swiftly identifying key insights in the feedback data you collect. As part of the Netigate report function, the feature offers you intelligent analysis in the following ways:
• Highest and lowest-ranking questions
• Enhanced NPS visualisation and benchmarking
• Segmented analysis
• Over time analysis
• Instant series rankings and comparisons
• Action-planning and tracking segment

Take the video tour
Watch our 2-minute video to see Quick Analysis in action.
Feature benefits

Get instant insights from your survey results.

Save admin time by removing the need to manually sift through data.

Compare results across series and get instantaneous rankings.

Take NPS to the next level with benchmarking and progress tracking.

Comparison of highest and lowest ranking questions with Netigate Quick Analysis
Highest and lowest-ranking questions
Look at all available weighted questions in your survey and rank them by the overall score given by respondents.
✔ Instantly identify where the company is doing well.
✔ Immediately highlight areas requiring improvement.
✔ Compare highest and lowest-ranking scores across multiple different series.
✔ Treat each matrix row as a separate question.
✔ Define how many questions you would like to appear in your analysis.

Enhanced NPS visualization with Netigate Quick Analysis
Enhanced NPS visualization, rankings and comparisons
Get a comprehensive breakdown of your Net Promoter scores by series.
✔ Breakdown of promoters, passives, and detractors along the NPS scale.
✔ Rank and compare series by NPS.
✔ Quickly identify highest and lowest NPS performers.
✔ Instant visualisation of how each series compares to the total result.

Quick Analysis_NPS_4by3_Shadow
NPS benchmarking
Measure your performance against existing EX and CX standards.
✔ Add benchmarks to compare your performance to existing standards.
✔ Visualise benchmarks in relation to ranked series and the total result.
✔ Visualise your benchmarks along a progress bar in relation to the total result, individual series, and even multiple series.

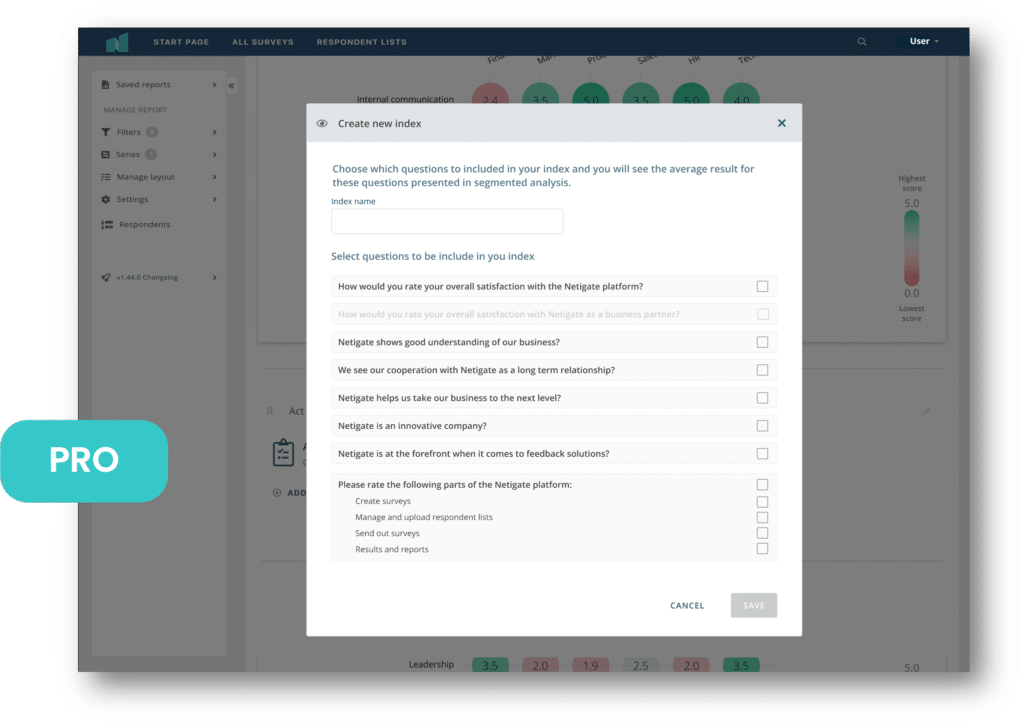
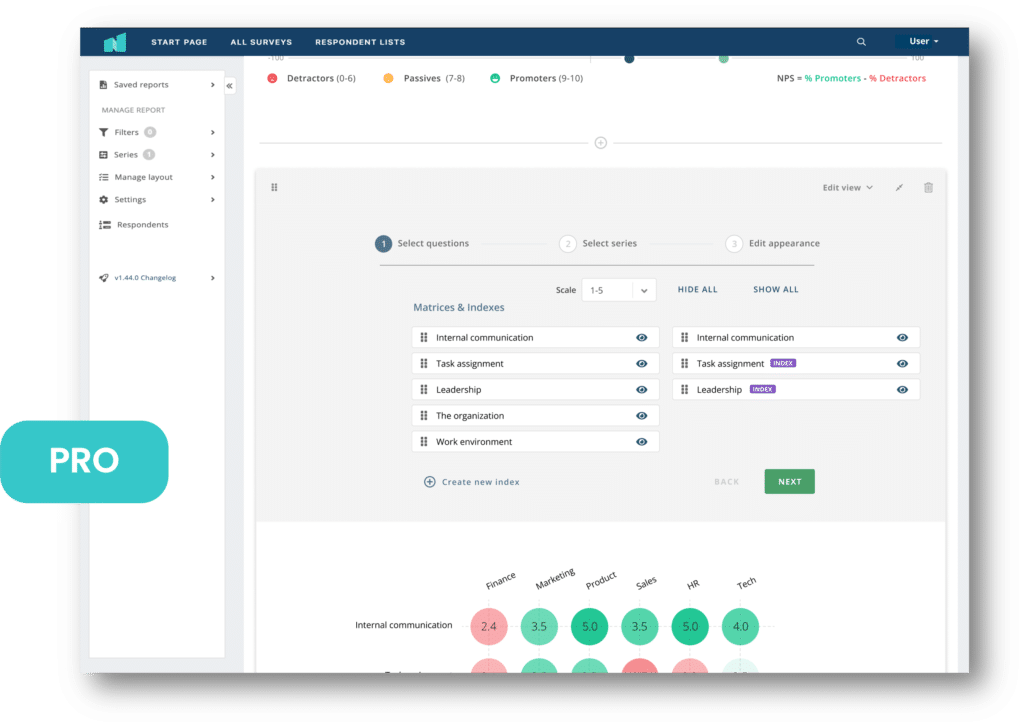
Segmented analysis
Dig deeper into your data by segmenting your results.
✔ Break down results by subgroups within your organisation or customer base
✔ Evaluate the averages of several questions at once.
✔ Decide which questions or indices to visualise together.

Over time analysis_EX_Pro
Over time analysis
Instantly visualise how your results are changing over time.
✔ Track progress towards your goals.
✔ Specify which questions you would like to track.
✔ Choose which time period you want to view results across.
✔ Decide how you want to group results across a time period (e.g. days, months, weeks, etc.)

Action planning based on insights in Quick Analysis
Put insights to work right away
Secure ROI on your feedback projects by planning your next steps and tracking your progress directly in the platform.
✔ Add as many action points as required.
✔ Set due dates for each action point.
✔ Track progress by marking completed as ‘done’.
✔ Missed deadlines are highlighted for action.

Quick Analysis 2.0 Brochure Cover