


Surveys help you collect valuable insights about your customers and your organisation. But what do you do with all that rich and powerful data once you have it? How can you make sure those insights are analysed and visualised in the best possible way?
At Netigate, we’re constantly working on ways to improve how you both collect and understand feedback. That’s why we’re excited to announce a modern new look and enhanced functionality to your data reports in our software.
New Report: An Improved Way To Manage Your Data
The goal of this update is to give you a faster, simpler and more flexible way to display and understand your survey information.
We think it will not only help you break down feedback more effectively. But also provide you with better ways to share them within your company.
Curious to know the reasons behind the new report? It’s not just about giving the software a new face; we solidified its foundation so that we can add additional functions and features in the near future.
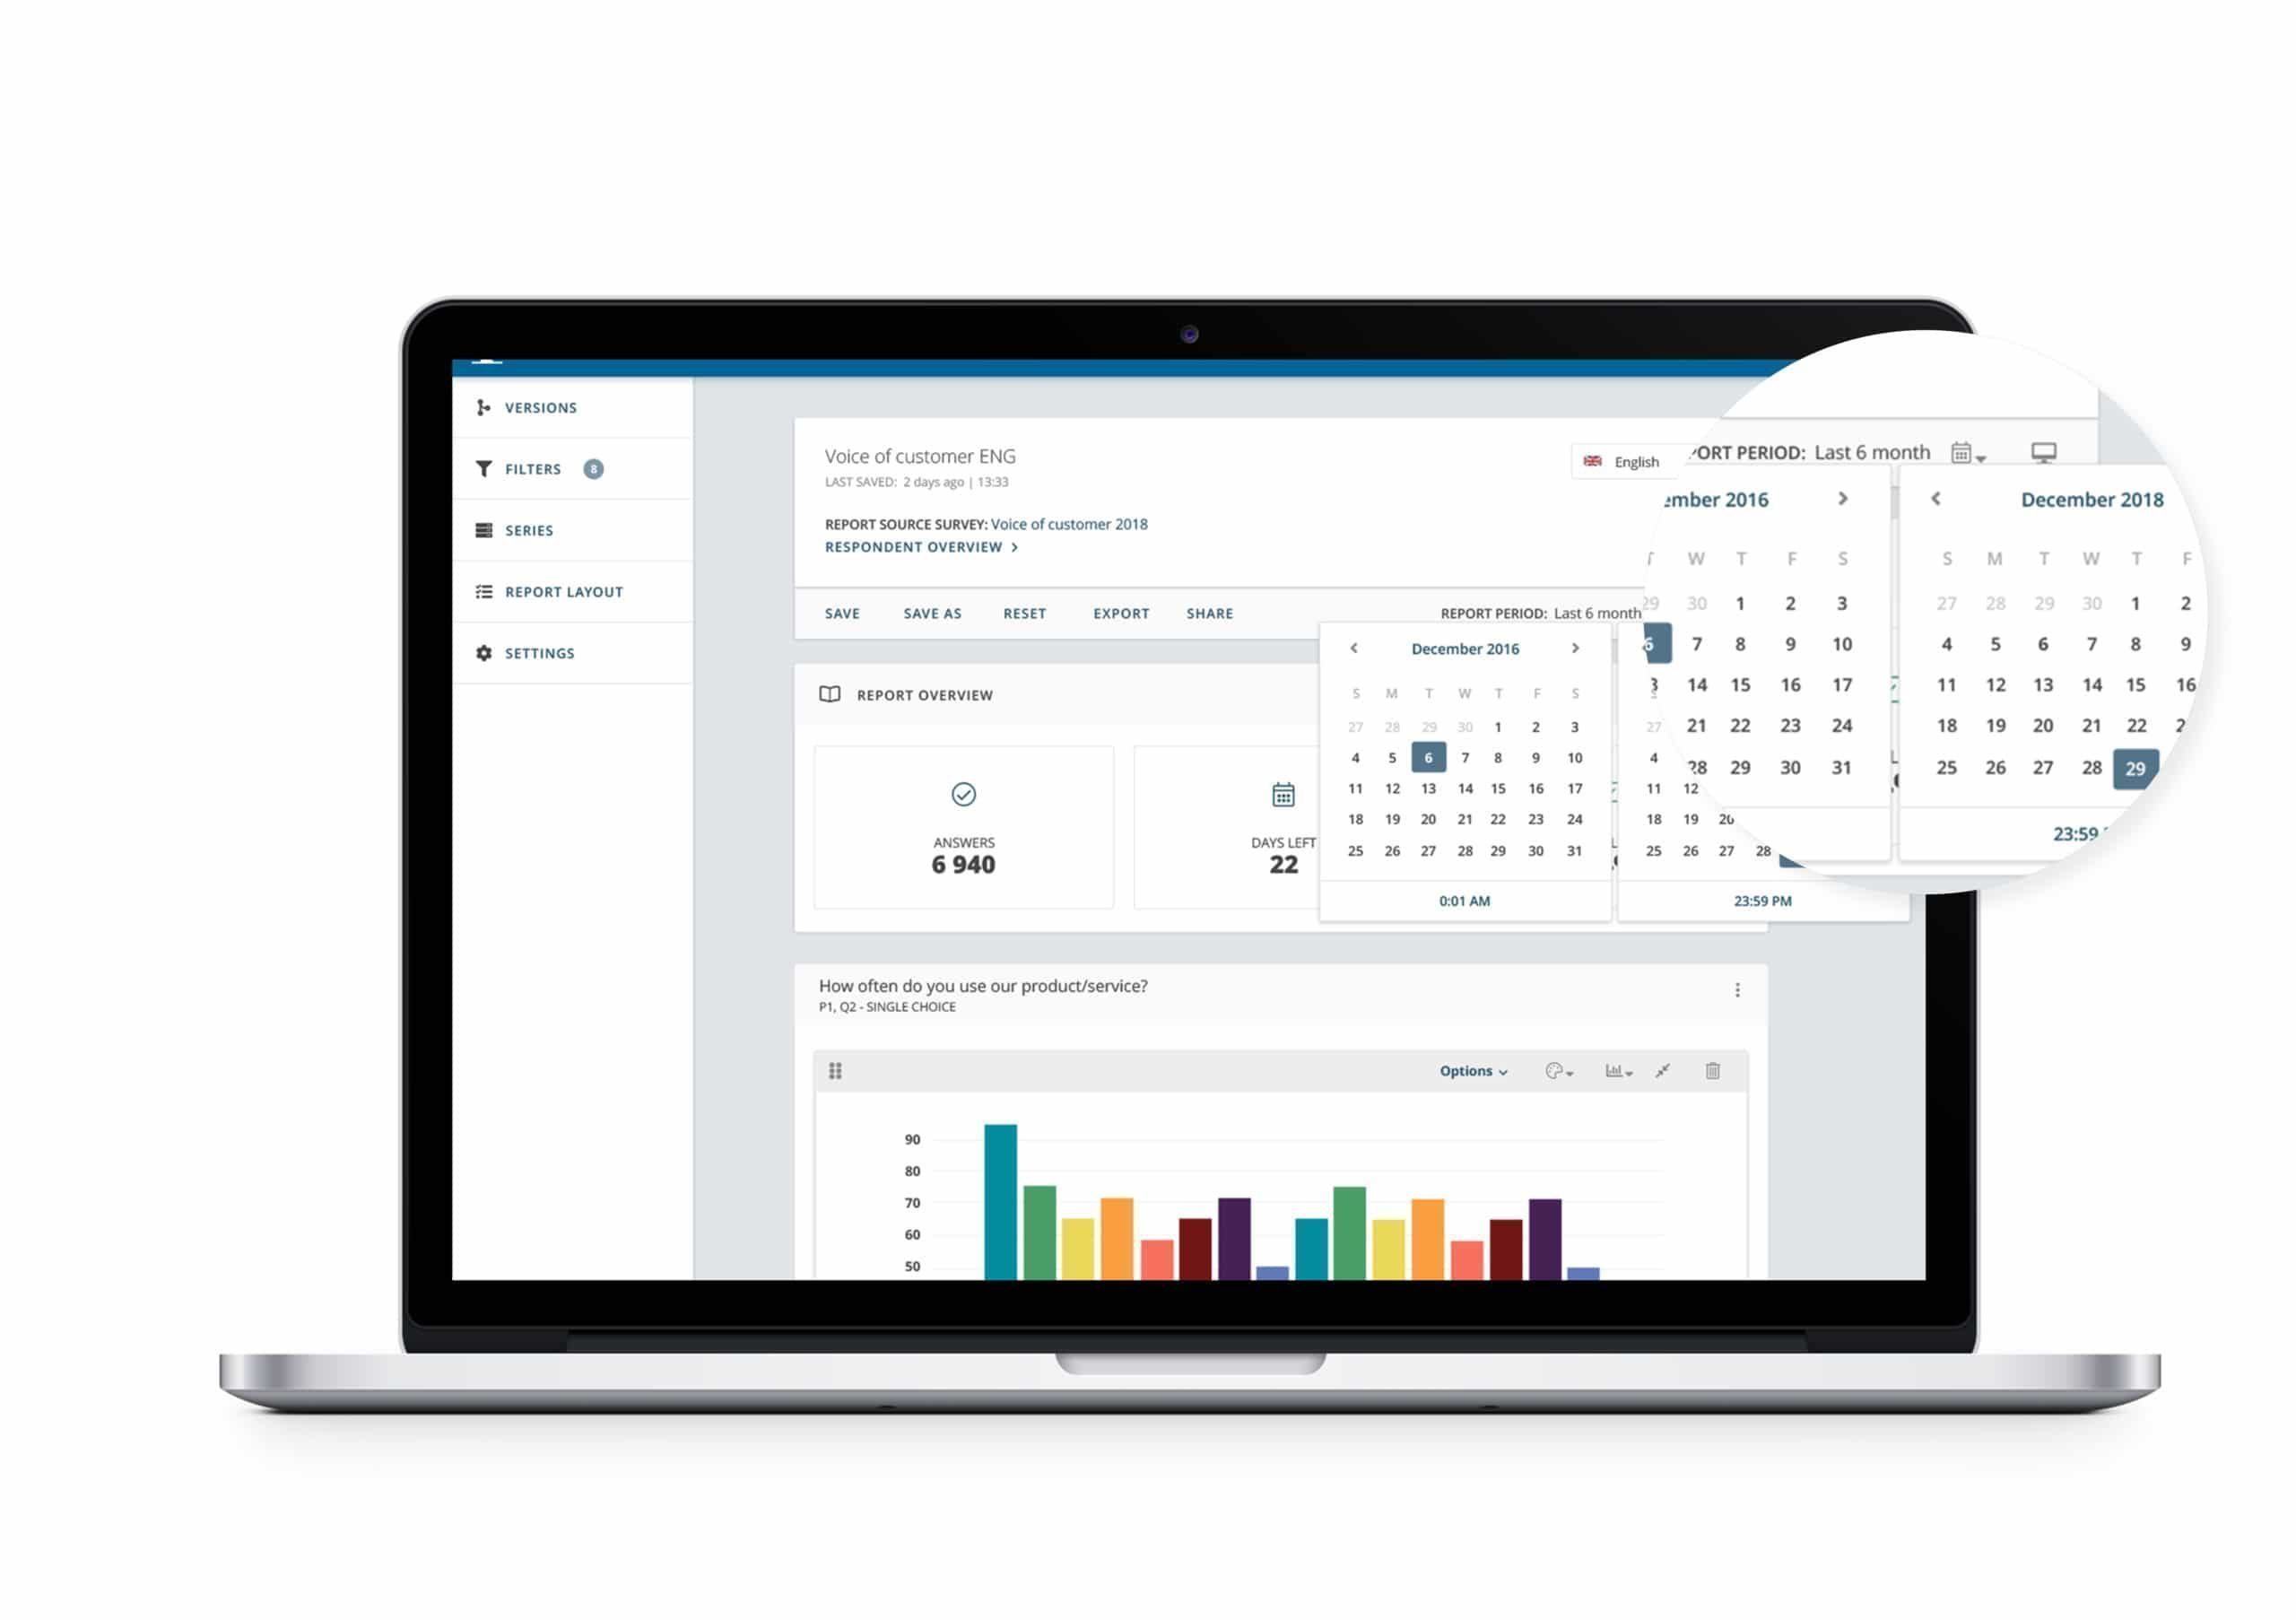
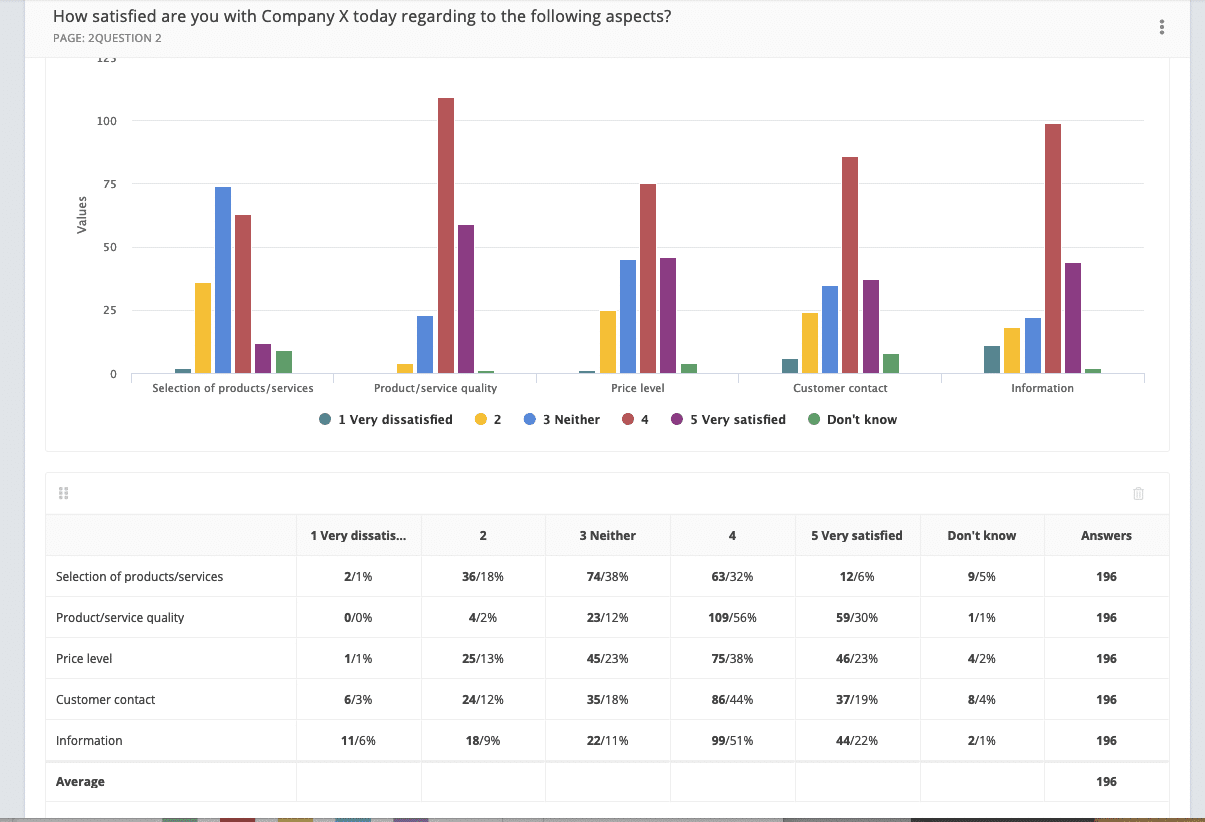
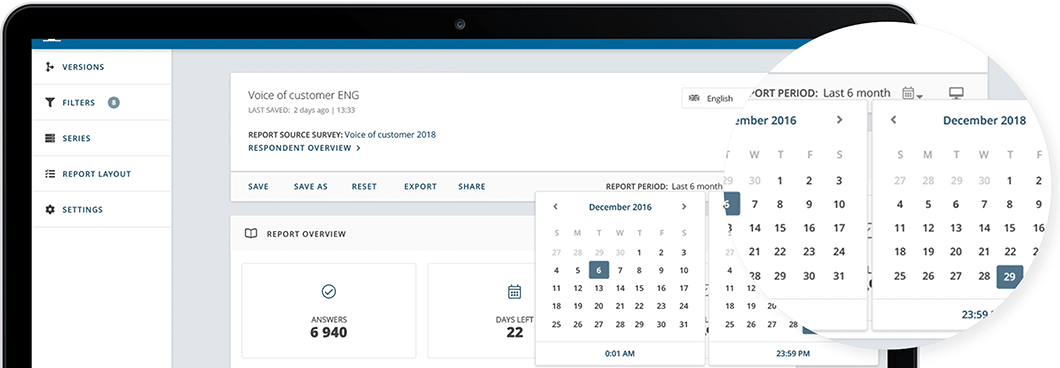
Netigate’s revamped report is now optimised to handle large amounts of data, so there’s no limit to the ways you can slice and dice your survey analysis. Want to add, remove, or adjust the data? You decide what results are the most relevant to each query and data breakdown. For example, a multinational company can now export multiple surveys for individual markets with the click of a button.
“Our new reporting allows you to set up your reports in a way that suits you best,” said UX lead Marie Nilsson. “We wanted to give our users a powerful product that’s not only easy to use but saves time in the long run.
What can you do with the new report structure? A small sample:
- Export and share multiple versions in your preferred format and download or email them as many times as you need.
- Filter your past results, either on fixed or rolling date ranges. You can compare your results by weeks, months, or quarters, or set date ranges on whole reports or on specific series.
- Do a deep dive into individual responses or a particular segment. Search, filter, and sort all respondents or a specific series. You can also view, export, or delete your respondents’ answers.
- And much more, with new features added regularly.
To make sure we built the most valuable resource for our customers, we involved them heavily in our research and testing process.
“For us as a product team it was important to include our customers in the early stage of the development,” Nilsson said. “Their input has been crucial in designing a report that works for companies of all sizes.”
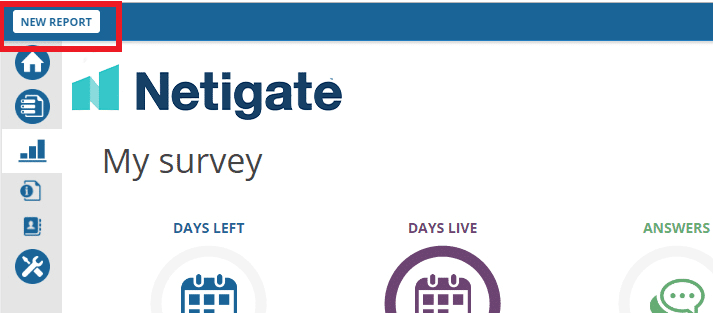
Curious about how to access the new report? Switching between our classic report and the new version is as simple as clicking the “New Report” button on the top left corner of your report.

