


After almost two years of development and a six-month Beta-phase Netigate launches a new version of its platform! Version 8 – also called “New Netigate” – was designed with four focal points in mind: security, stability, user-friendliness, and future security. Based on the feedback we have received from our users over the years, those four factors were the driving-force behind every technical and functional decision made during the development period.
The new version of the Netigate platform has been gradually implemented for users since 1st September 2020. Users with access to the new version are able to switch between the classic and the new version via a toggle within the platform.
So easy – and so secure!
As soon as you gain access to the new version, you can just as easily access all existing data in Netigate. All surveys are still running as before and without disruptions, which ensures all collected data remains unchanged. In the new report column, you will be able to look at all collected answers from your previous survey projects. If you have collected and saved reports from surveys in the classic report system, you can easily transfer them into the new report system to be able to continue using and editing them.
What does New Netigate have to offer?
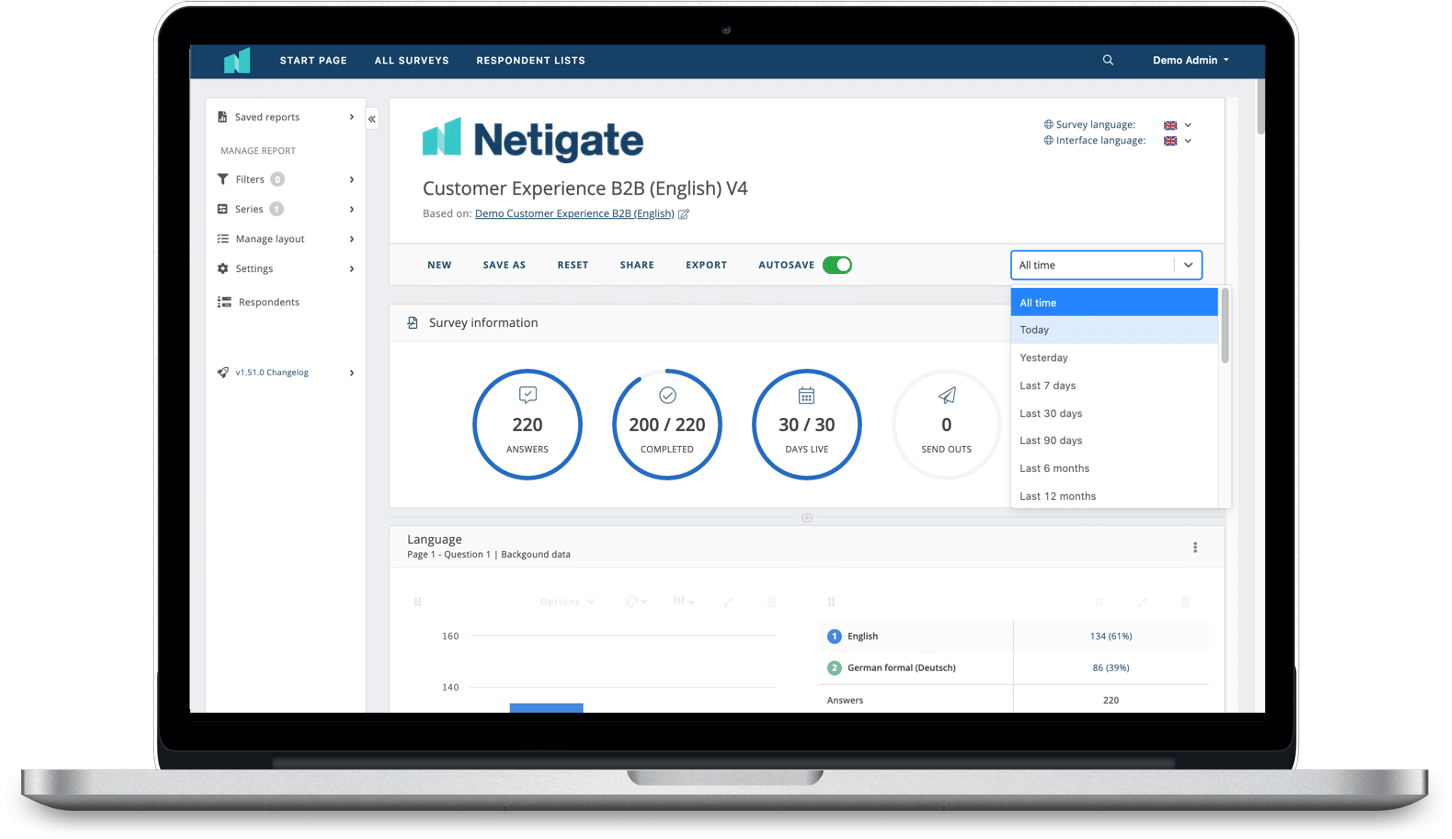
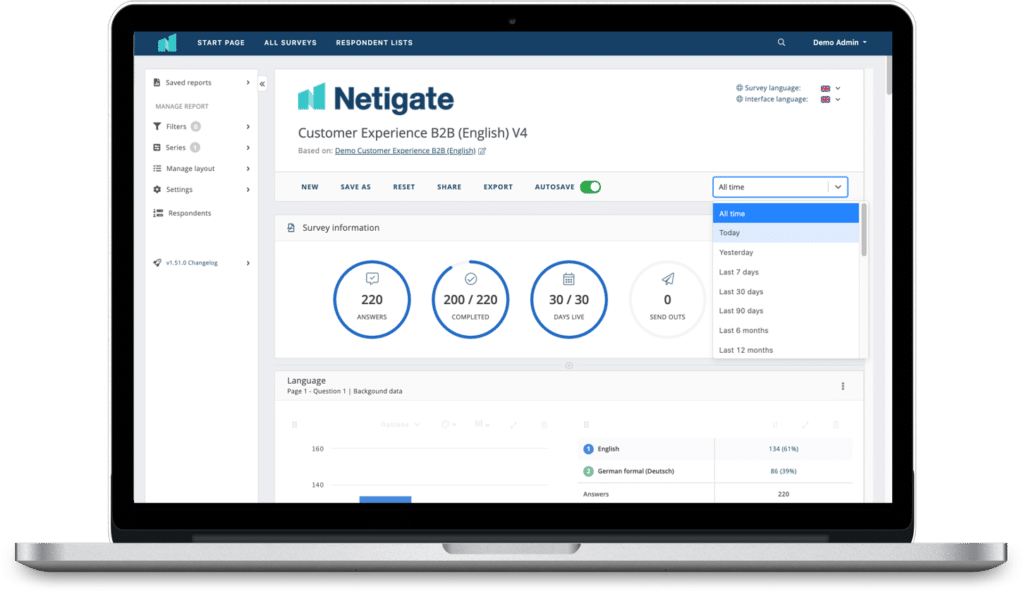
In general, Version 8 has a higher capacity to work with large sets of data and offers more possibilities for the customisation of data display in comparison to its former version. There’s also a brand new, modern interface.
1. The same great tool made better
You can access survey templates within the Netigate platform more easily, while transparency has been upped as well: you will be able to see the progress of the survey participants, i.e. Who has opened the email, clicked on the link, or completed the survey? On top of that, importing the participants’ data has been validated and a new mapping function has been implemented to facilitate adding and updating existing lists of participants.
The new “website survey” add-on means that you now easily add a survey to your own website to gain direct feedback from users.
2. Even more user-friendly
The top bar, which is now visible on all sites within the platform, makes navigating the website easier and more accessible. New filter options and an improved search function help you find things quicker than before, while explanatory texts and tips guide you through the platform from beginning to end, in case you have just started working with Netigate.
The calendar on the start page displays all previous and upcoming activities and surveys. This helps to keep you up to date, organised, and provides an overview of your survey projects.
3. New result presentation
You can use a new, flexible layout for the presentation of your results. You can adapt the contents of your Netigate survey by easily adding, moving, hiding, and deleting questions as you please.
New analytical add-ons, such as Target Values, Thresholds, and Custom Indexes help filter and uncover your strengths, opportunities, and areas for improvement. You are now also able to share multiple versions of live surveys (on the basis of series) with your entire organisation. You can generate every link to shared surveys as password protected and in conformity with data protection.
4. Increased performance
A new structure to deliver emails and SMS ensures a scalable and reliable distribution of your survey respondents. The use of new technologies furthermore reduces the overall loading time. This means millions of data points can be broken down and filtered within seconds!
The most important upgrades at a glance:
- More metrics for your survey data: i.e. timeline for received answers, drop-off analysis, custom index (CSI, ESI, average)
- Increased flexibility: move, delete, or add questions
- Quicker selection of time frames – globally for the entire report or with custom time filters for each series
- Left bar: manage reports, filter, series, configurations and the layout
- Search bar in the word cloud with the option to add a table with answers
- Share multiple versions of a report and create reference series between report versions
- Remove added filters directly within tables / graphics
- Easier work with rows and weighted matrices – showing average values rather than a distribution (possible to use filters)
Where can I find further information on New Netigate?
You can visit the Netigate Success Center to access articles and training videos if you have questions regarding your survey projects. You can find everything from designing a questionnaire to using filters as well as sending and reporting. We will update all information here constantly throughout the transition phase to Version 8.
If you have further questions, you can always reach out to us via this contact form or talk to your Netigate Account Manager.


 Copyright © 2025 Netigate AB, Drottninggatan 25, 111 51, Stockholm, Sverige