


The first thing we see when viewing the result in the insight platform is the information at the top of the page. This will always be here regardless of what type of survey you’ve done.
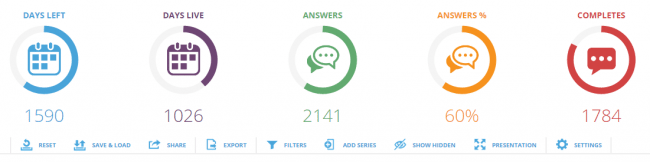
On the top row we get some valuable insight regarding the survey; Days left and live, amount of answers (absolute numbers and percentage) and amount of completes (the amount of respondents that completed the survey).
Below that we’ll find the different tools at our disposal when working with the result. This toolbar will also follow us when we scroll down to view the result so that we won’t have to scroll back to the top to use any of the functions.
- Reset – Resets the result to its default mode to create and view new reports from your survey.
- Save & Load – Save and manage your existing reports in this survey (You can read more here).
- Share – Share your saved reports with colleagues, managers or clients! (You can read more about it here).
- Export – Download your report to different formats (Read more about the export options available here).
- Filter – Filter your result on different time periods, for example a certain month, week or 5 day period. You can also view your different series you might have created here.
- Add Series – Click on Add series to add two new series to your result to work with comparison of different questions and options (You can read more about our Add series and cross tabulation functions here).
- Show hidden – Click show hidden to show any questions you might have chosen to hide in your report.
- Presentation – Click here to enter presentation mode straight away in your browser. A great way to display the result straight away in meetings!
- Settings – A couple of different settings for your result (read more about them here).
When viewing the result of a question
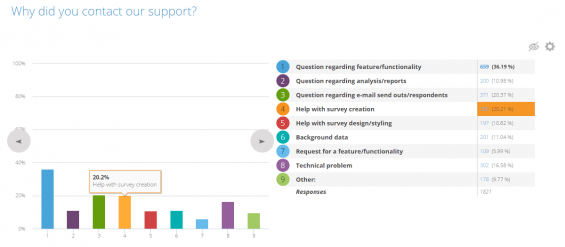
When looking at the result of a question you will always see the different options the respondents could use to answer. As well as the amount of answers for each option in both absolute numbers and percentages. A total amount of responses will also be shown at the bottom.
A graph is automatically displayed, the graph type can easily be changed by using the left and right button as seen on the image above on each side of the graph.
In the top right corner of the question two small icons are displayed.
If we click the eye we can hide the question so it won’t be displayed when we share our result. To revert this setting, click show hidden at the top and then click this symbol again.
The Cogwheel allows us to enter the settings of the question to change graph the existing graph(s) and add new to display the result of this specific question for example over time.
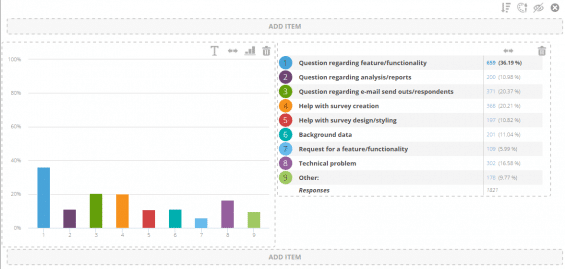
We now have the option to add a new item to our question. An item could be a new graph, a new table or an info text. You can also expand the width of the existing items by clicking the two opposing arrows or add text to a graph by clicking the T. Click the small graph symbol (3 stacked bar chart) to change chart type, or the trashcan to delete the item.
In the top right corner you have the option to re-arrange the options in alphabetical order instead of the order they were entered when you created the question. You can also click the color pad to change the colors of this specific graph. The symbol to hide the question is still visible and the symbol to close the edit mode is visible to the far right in the upper right corner.
Open text answers
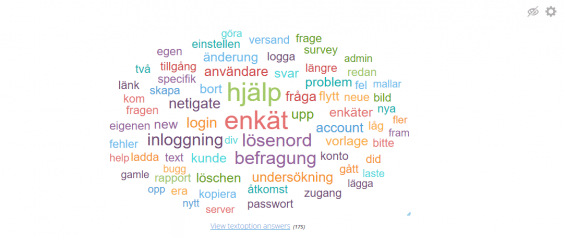
All open text answers are by default presented as a word cloud as shown above. The settings and hide function are also available here at the top right corner.
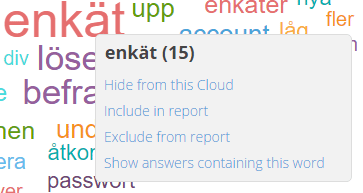
By clicking the words you’ll see the amount of times the words have been used by all respondents. You will also be presented with the choice to hide the word from this specific cloud, include in report. This works like breaking down the result on a specific option in a question. So in this case only the 15 answers from the respondents and wrote this word will be displayed. Exclude from report excludes it from all the clouds in this report. If you click Show answers containing this word we’ll see all the open text answers that this word is a part of.
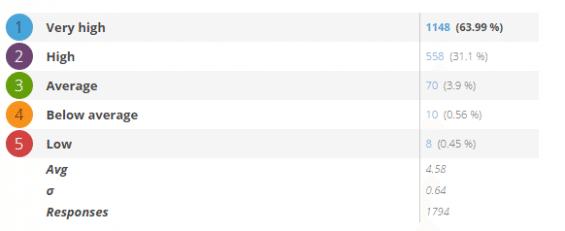
Weighted questions
Weighted questions will always show the average value of the result and standard deviation of the result as show below.
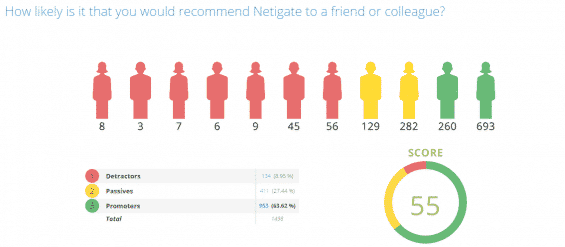
NPS
The NPS questions will always be displayed as the image below with the score. Coupled with the amount of detractors, passives and promoters, the NPS question can of course also be edited to change graph type and more. If you want to read more about NPS you can do so here.